
In a world of auto spread trading (auto-spreaders), systematic arbitrage and automated market making, nearly all markets are being traded against each other in one way or another. For discretionary traders, the sooner you can broaden your market perspective to consider the price action and order flow trading across asset classes (related markets) the better you will get at trading with the smart money. This exercise aims to get you thinking about correlated markets and align your perspective with how professionals are looking for opportunities based on value.
If I were to put money on the most important skill professional traders have – it is finding value. Whether that be through experience (are these prices cheap), professional resources (real-time market statistics) and advanced algorithms (machine learning), proprietary traders, market makers and position traders consistently making money have systems in place for trading where there is value. What does ‘value’ even mean?
Day trading professionals often determine value in a single market relative to prices where a lot of volume has traded in recent history. In this instance VWAP is a common tool used for determining if current prices are valuable. Another value concept worth understanding is ‘relative value’, which is used a lot in the futures markets by comparing prices in one market vs prices in a correlated market, or even across multiple asset classes. This exercise hopes to get you thinking and trading in terms of ‘relative value’ in the context of spread trading.
Spread Trading Drill Preparation
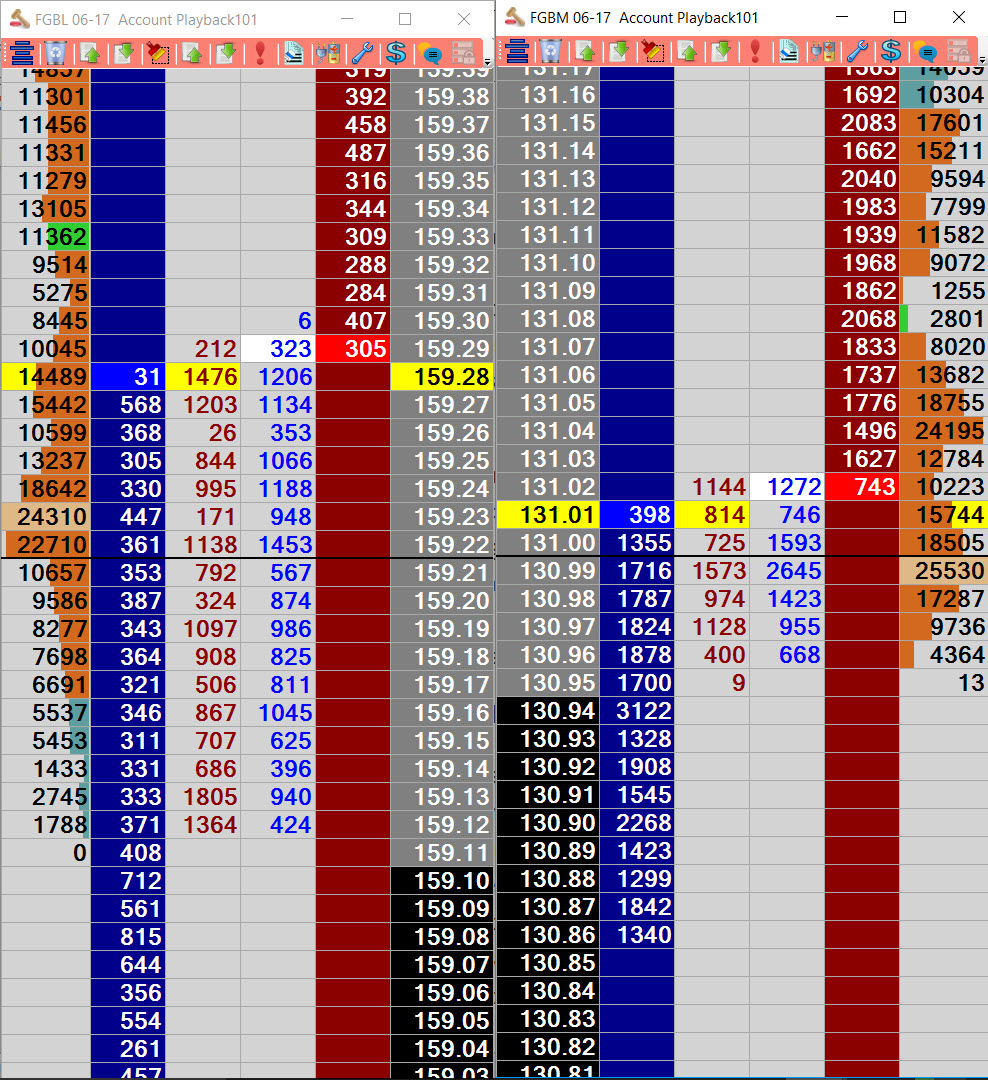
- Bring up two DOM ladders for markets you suspect are correlated. One market should be your focus market for previous exercises, or you can do this exercise with any two market’s you think are correlated, as long as you can view a DOM for each market.
- Determine the hedge ratio (see a shortcut for this below)
You can do some google research if needs be to find a closely correlated market to your focus market. For treasuries this could be a different product on the yield curve (e.g. the 30 year T-Bond if trading the 10 year T-Note), or for index futures you could trade US equity indices (Nasdaq) vs Eurex equities (the Eurostoxx).
Determining Hedge Ratio and Position Size
Hedge ratios are used to determine the equivalent position sizes in each market. You will need to do some online research, or reference ‘A Guide to Spread Trading Futures’ available on the ‘Day in the Life of a Bond Trader’ blog to find out exactly how to determine the position size for each leg. If you just want to dive into the exercise, then for a quick estimate of the position sizes to trade for this exercise do the following:
- Determine last session’s trading range in ticks for market A
- Determine the equivalent trading range in ticks for market B during the same time period in step 1
- Find the ratio by dividing step 1 by step 2
- Repeat with different trading sessions to get the average ratio (3 or more times)
- Determine tradable position sizes for leg A vs leg B based on the average ratio
e.g. Average ratio (leg A daily tick range / leg B daily tick range) = 0.7
We cannot trade 0.7 of a contract.
Instead we trade 7 contracts in leg A and 10 contracts in leg B.
In case you missed the previous disclaimer – this is just a position size shortcut for this exercise. Different contracts will have a different value for each tick, so the dollar value could be drastically different for equivalent price moves. We are going to count ticks instead of dollars so you do not have to worry about the price ratio and other factors used in determining the precise hedge ratio, though it is certainly worthwhile learning how this is determined.
Legging Exercise Goal
Your goal is to try and ‘net’ one tick or more profit across both markets for each spread trade. For example if long Leg A you exit with a profit of 8 ticks (4 ticks price move X 2 contracts) and short leg B a loss of 6 ticks (6 ticks price move X 1 contract) you net 2 ticks profit. The general exercise aim is to get familiar with being long and short at the same time in two correlated markets, and to practice working a relative value spread position. To get started:
- Center both DOM’s so that the inside market is lined up for each leg.
- Make sure the position size for each leg matches your hedge ratio
- Try to get filled using a limit order on the Bid or Offer in one leg and immediately ‘hit’ the market in the opposite direction for the other leg e.g. If filled at limit on the Bid in leg A, then sell at market into the bid on leg B.
- Without recentering the ladders do the following:
– Watch each leg move in tandem to observe if they are actually paying attention to each other
– Watch the price gap between each leg expand and contract - Try and exit with a net profit. Exit with a limit order in one leg and then immediately hit out in the opposite direction for the other leg
To profit in this trading exercise you are going to have to pay attention to the relative value between the two marketseither entering when both markets are trading in value with each other and exiting when out of value (the spread has widened) or vice versa. A rough gauge for both legs trading in value is that prices are stable for each leg for at least a few minutes, with normal volume trading conditions. If your markets are indeed correlated you will quickly learn to spot relative value as you watch each leg trade in tandem.
Both legs are not guaranteed to trade back into relative value e.g. when the yield curve flattens or steepens. Generally speaking though, most of the time actual correlated markets will maintain relative value. If you have entered both legs and the correlation breaks down, for this exercise you should work both legs to exit for the smallest loss possible within a one hour window. Some proprietary traders will spend DAYS managing this scenario but you want to re-calibrate and look for the next relative value opportunity.
This exercise only scratches the surface of what is involved in spread trading. Significant volume traded (if not most volume) across asset classes is a leg of some spread or hedge trade with other asset classes, and most discretionary proprietary traders are spread traders. By understanding spread trading you will be better at determining where the smart money is trading. If trading outrights, paying attention to value in correlated markets will give you another edge in your trading AND in timing entries by interpreting leading information.